nVisual监测模块配置说明-首次必读
一、nVisual监测模块配置说明
nVisual监测模块采用Prometheus监控采集组件,针对nVisual集成预配置了一些参数(如默认监测告警推广送地址等),如需进一步了解Prometheus相关配置,请参考Prometheus相关资料。
1、下载软件包
下载地址:https://www.nvisual.com/download/
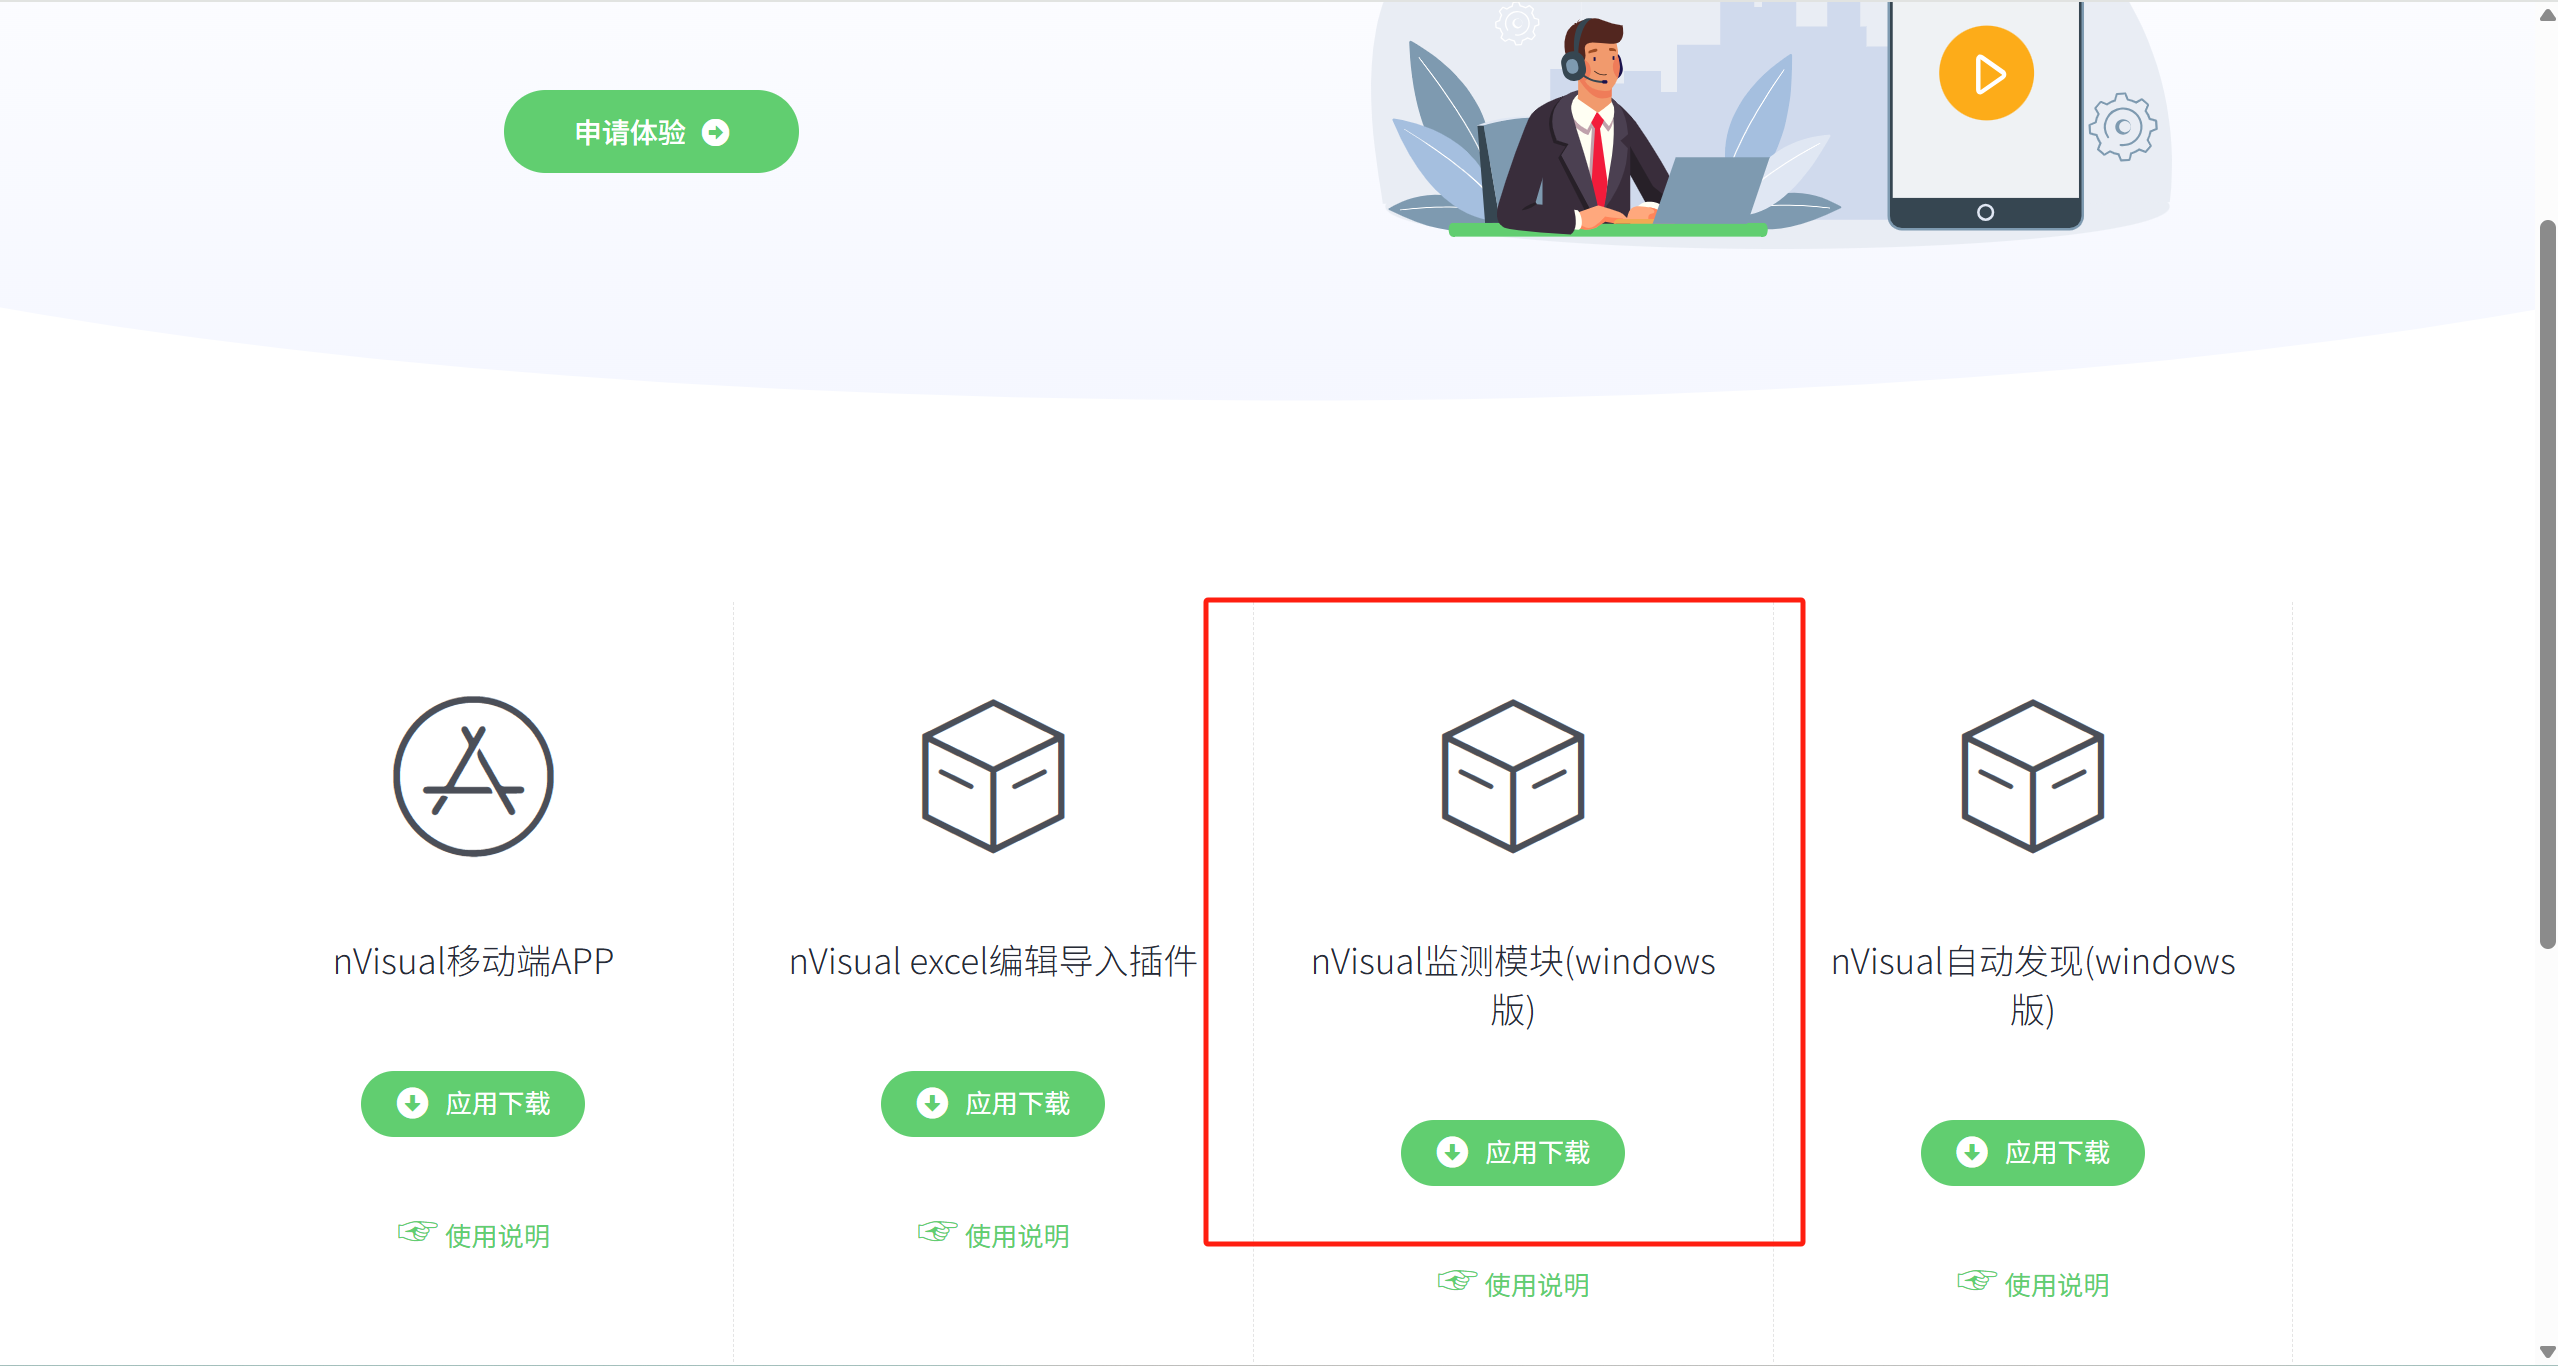
软件包为ZIP压缩包,下载完成后解压到文件(注意:不要解压到中文目录下)。
2、修改API key
Prometheus监测采集模块需要从nVisual发现监测对象、推送监测状态、告警到nVisual,需要访问nVisual的接口,因此首先需要获取nVisual的API key。
2.1、获取nVisual API key:登录nVisual——进入用户权限管理——API key——生成key.
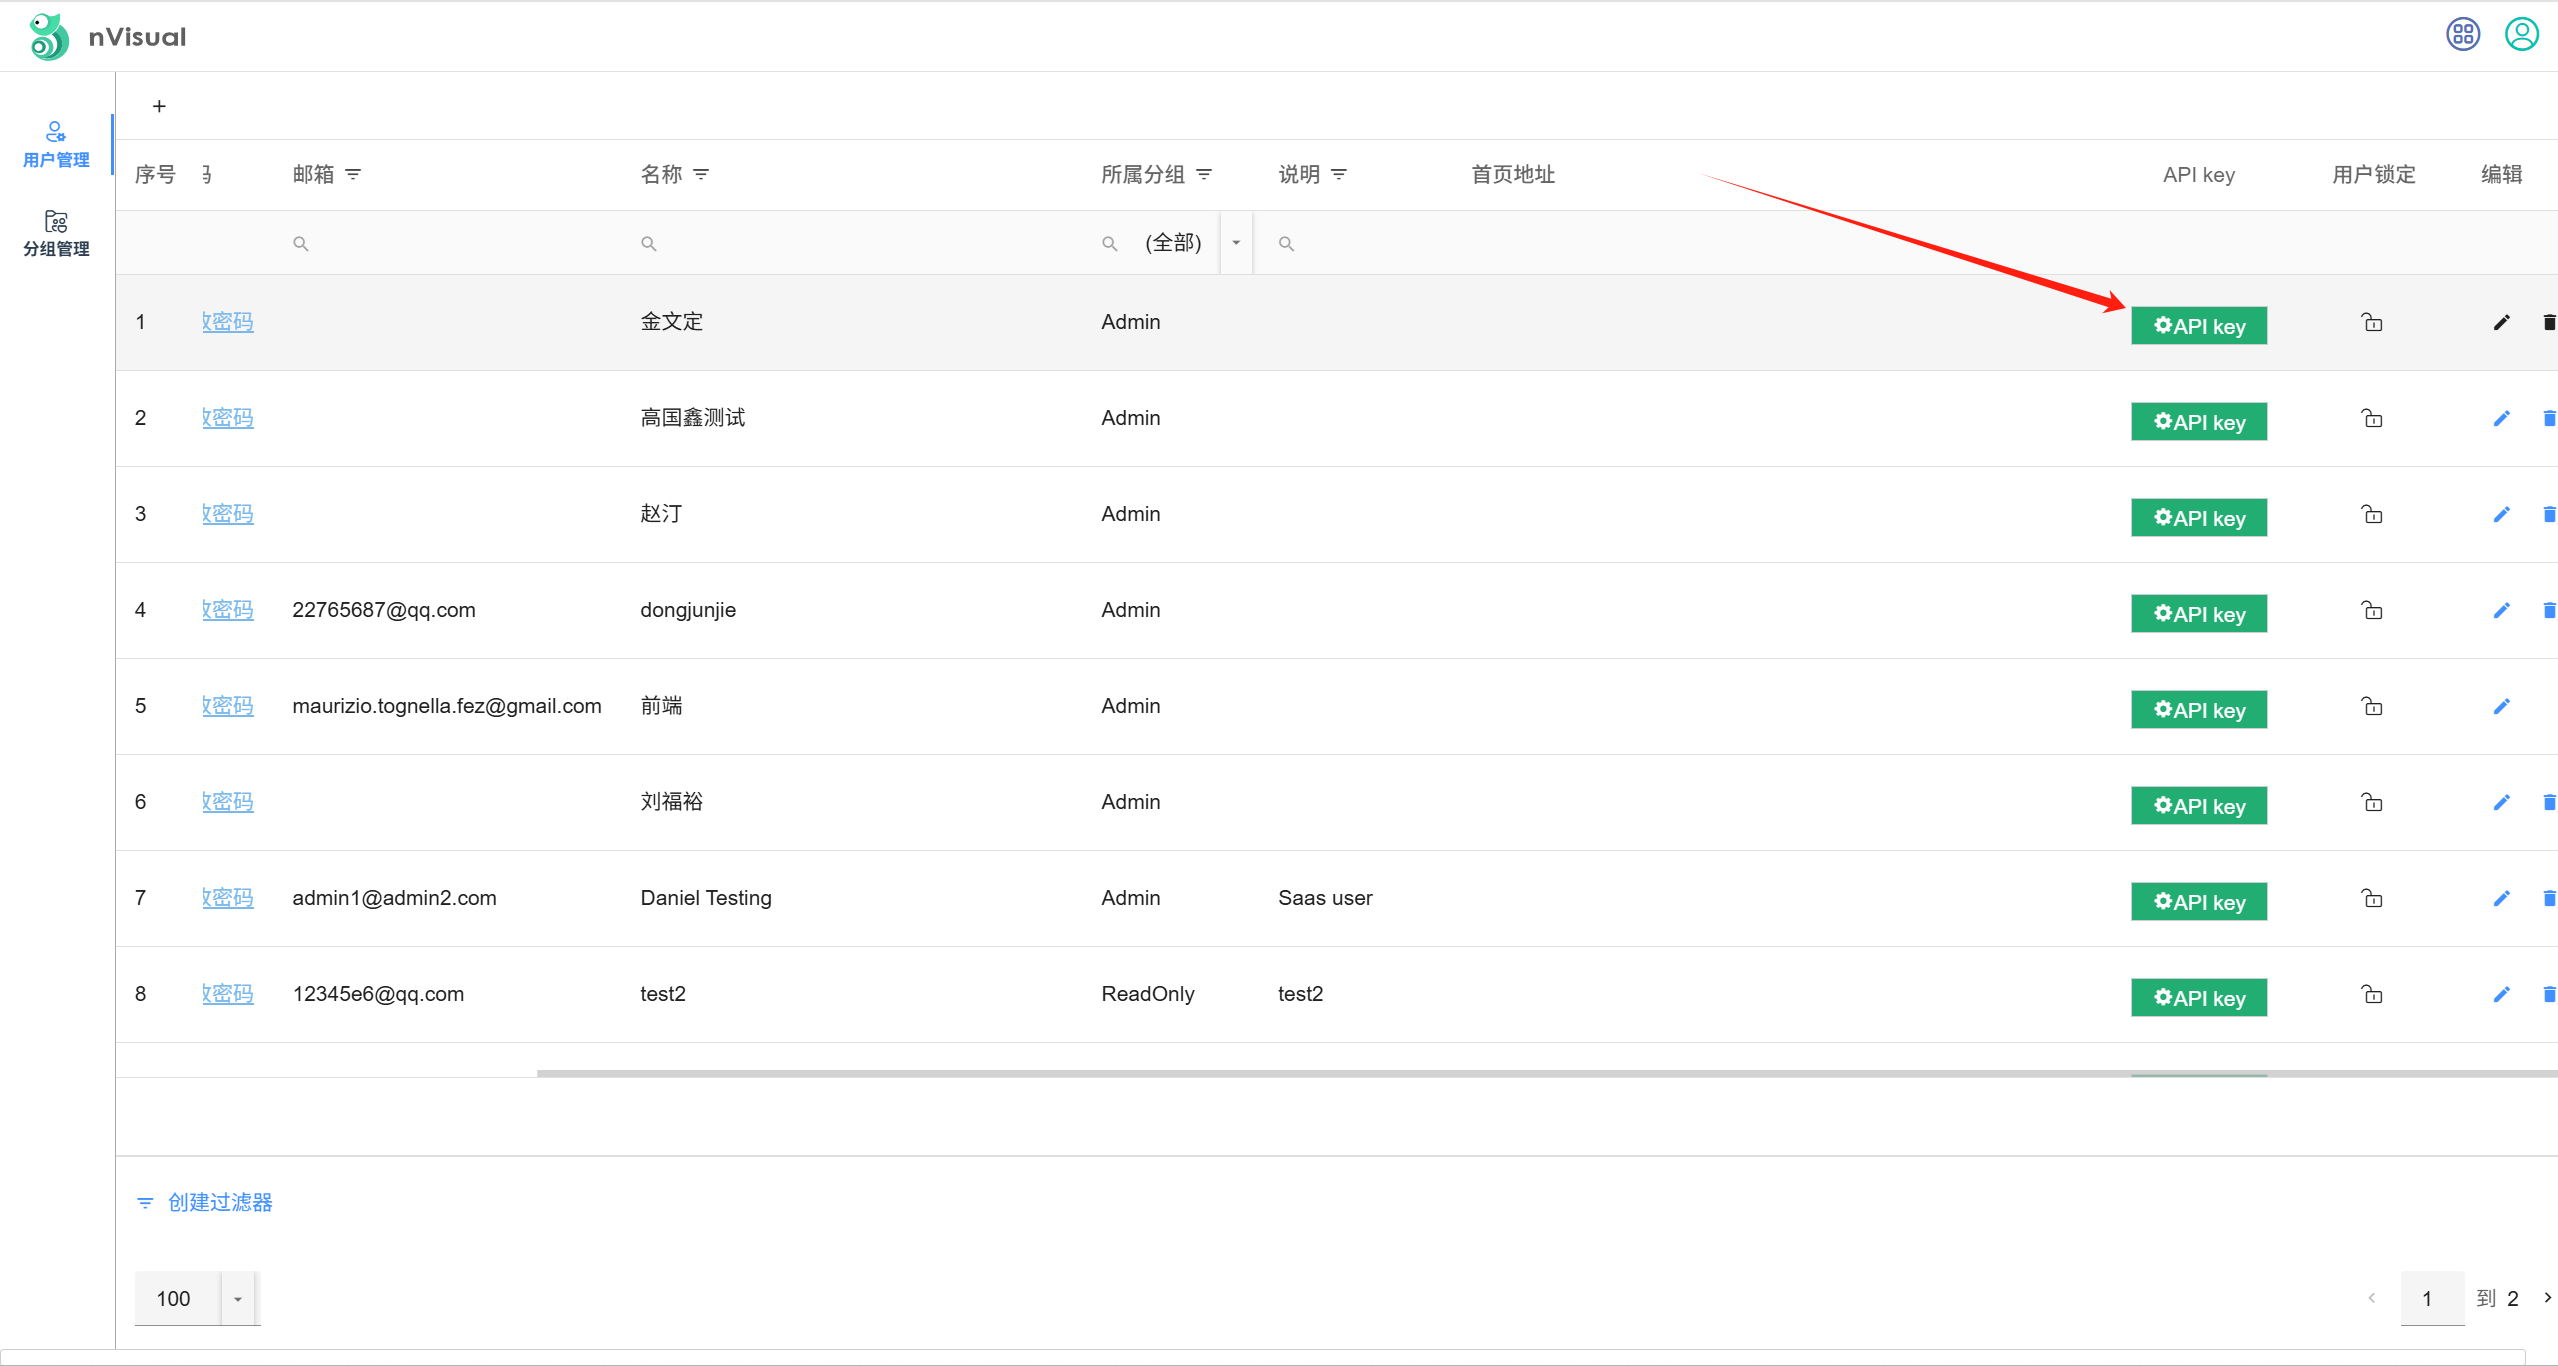
2.2、复制成生成的api key到监测模块下的api-key.txt文件里(注意:前后不要有空格)
3、启动监测模块
运行监测模块目录下的start.bat启动监测模块;
运行监测模块目录下的stop.bat停止监测模块;
4、添加监测对象
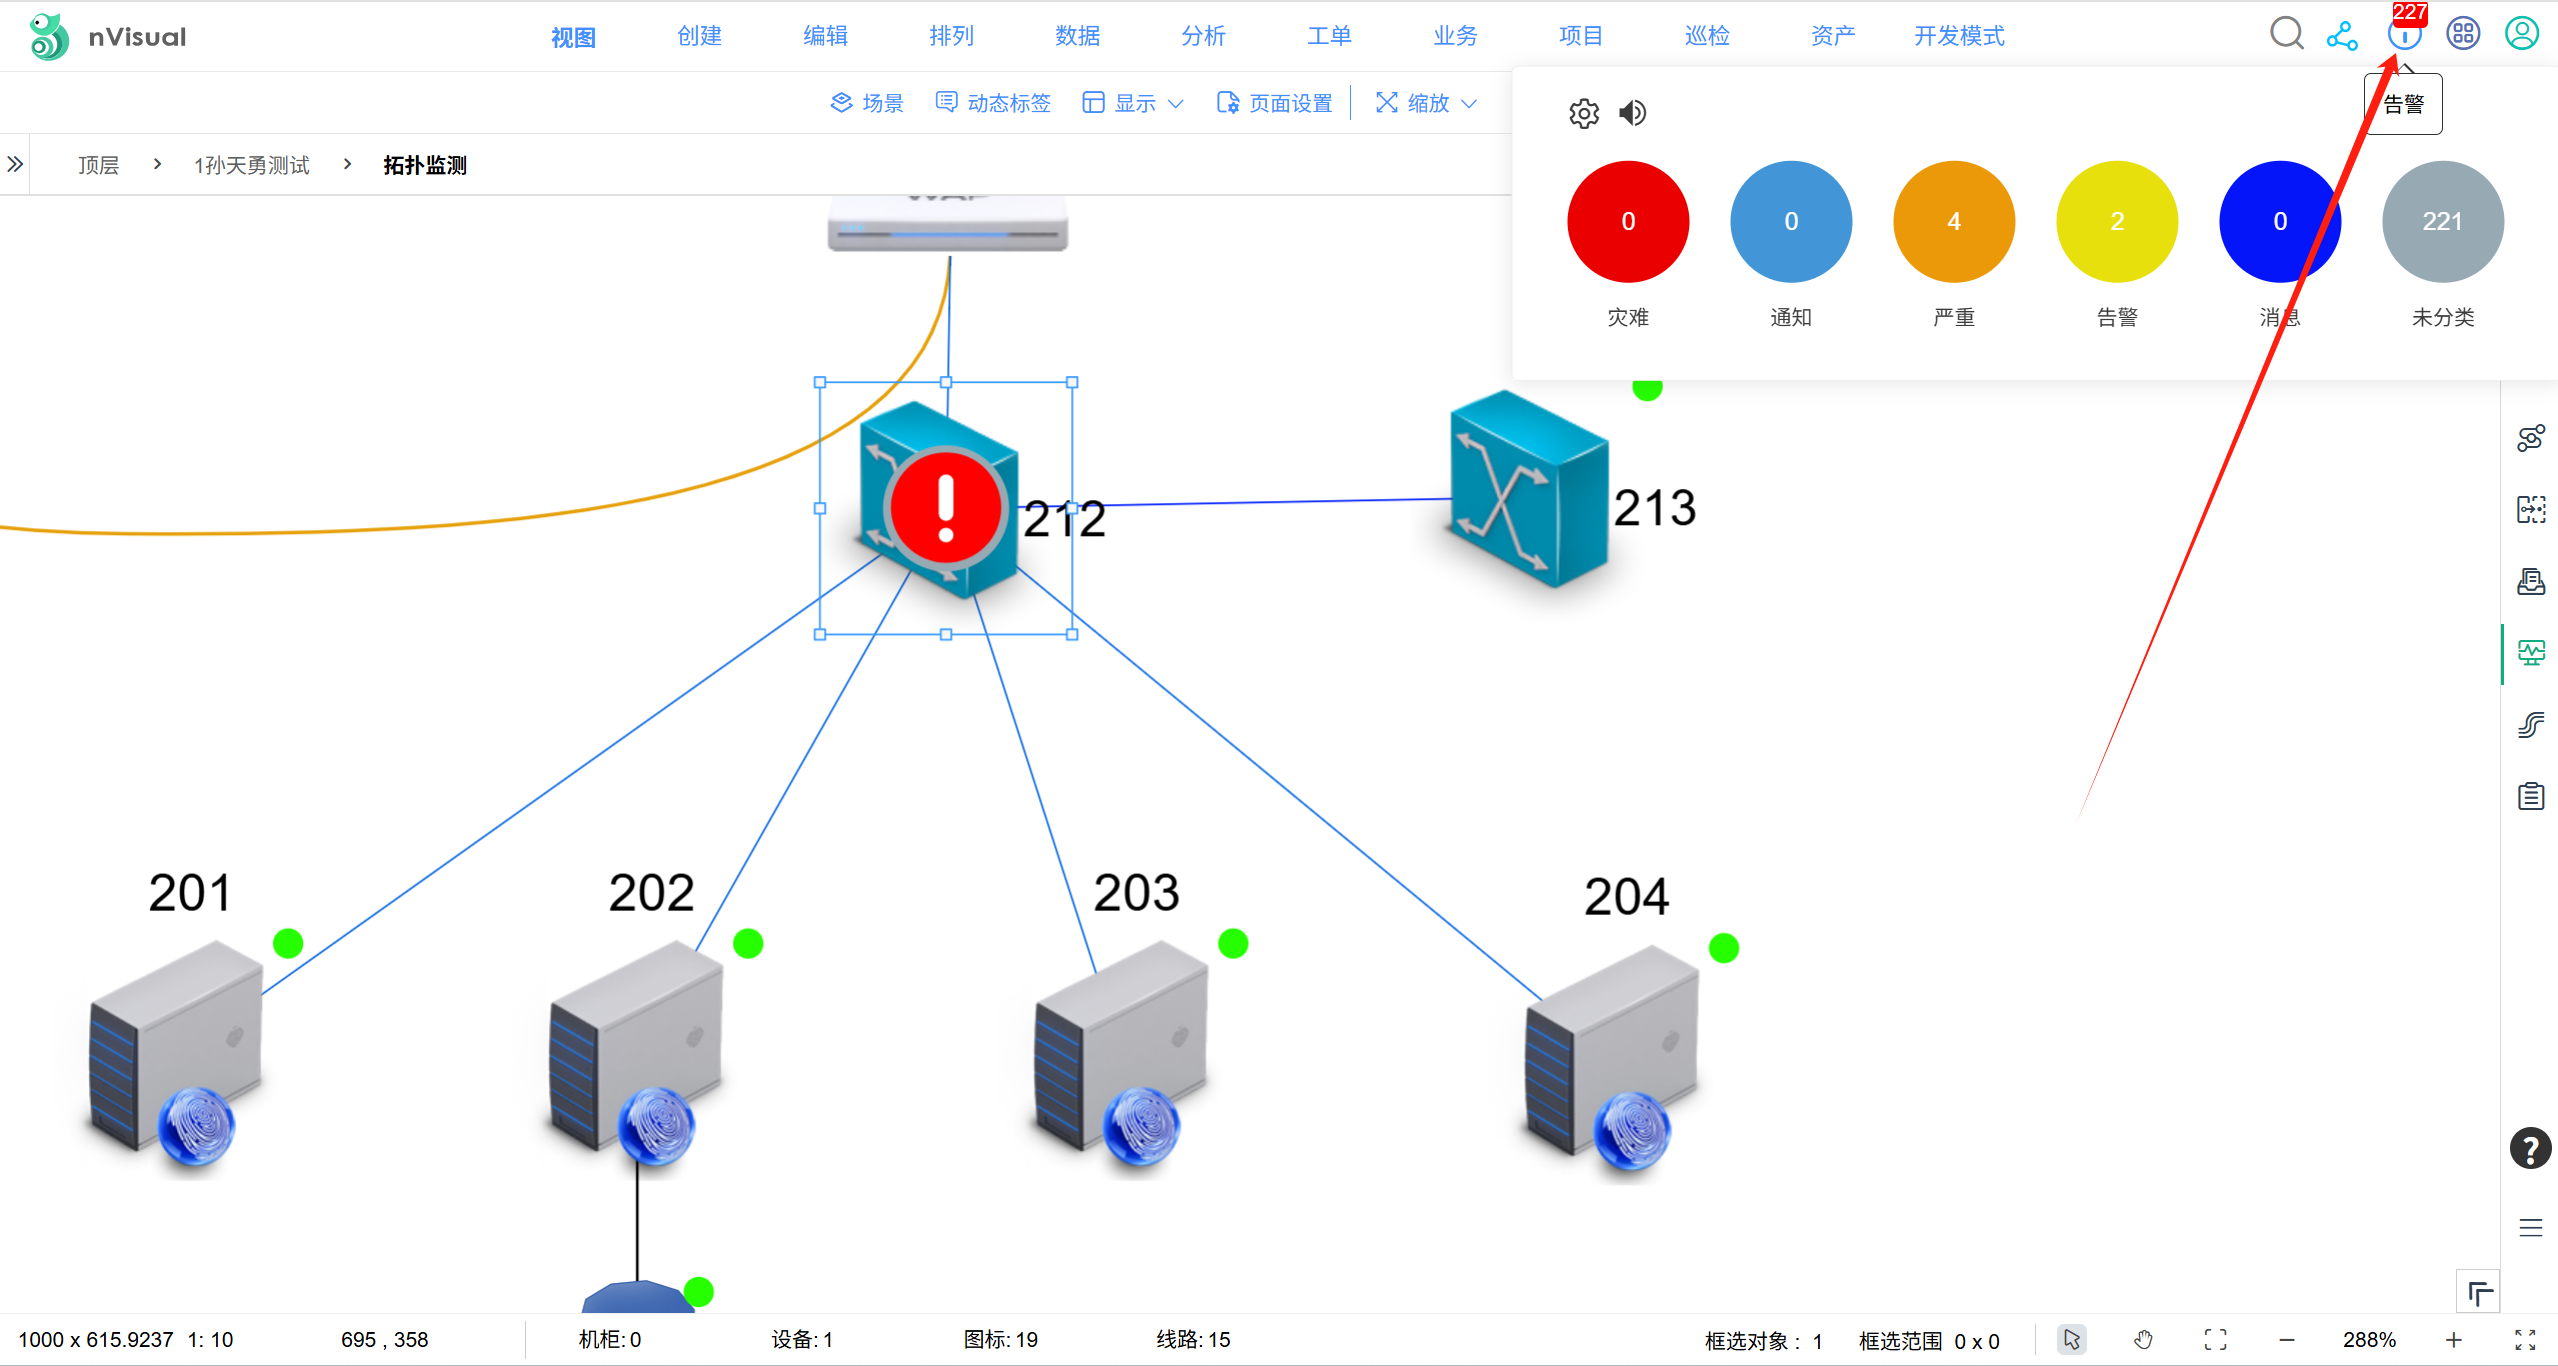
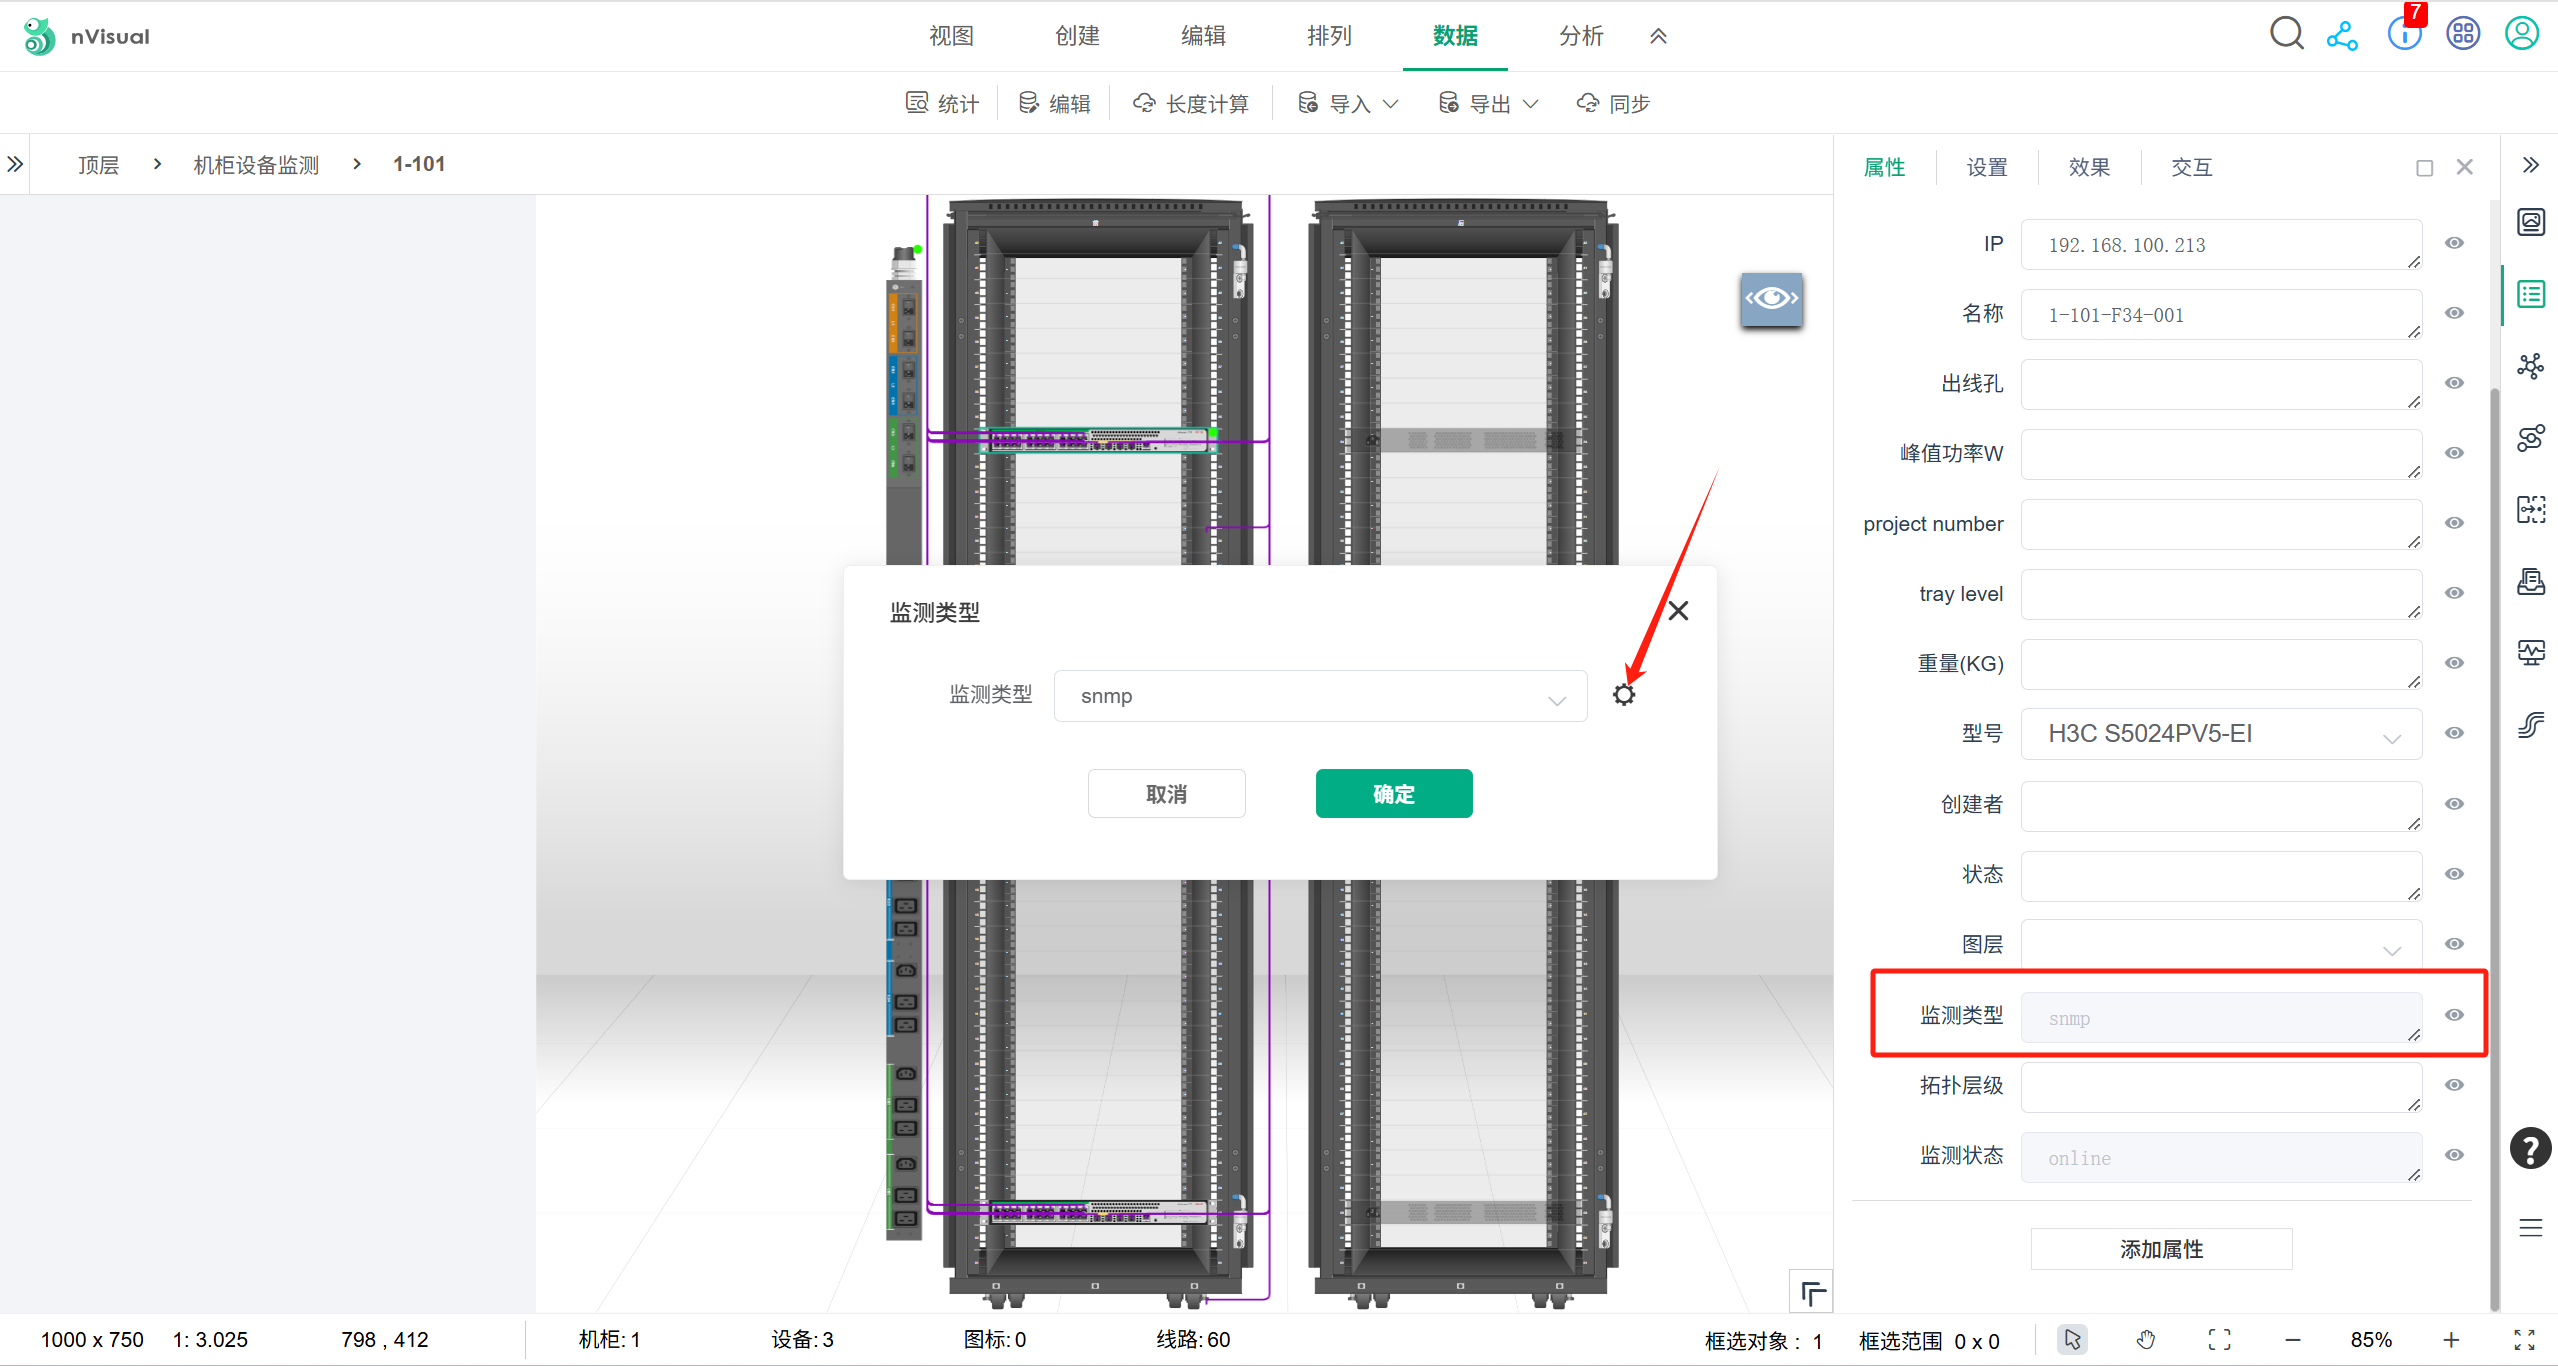
登录nVisual,在项目视图上创建对象图标,然后选择对象监测类型、IP,待1分钟后对象即进入监测状态:
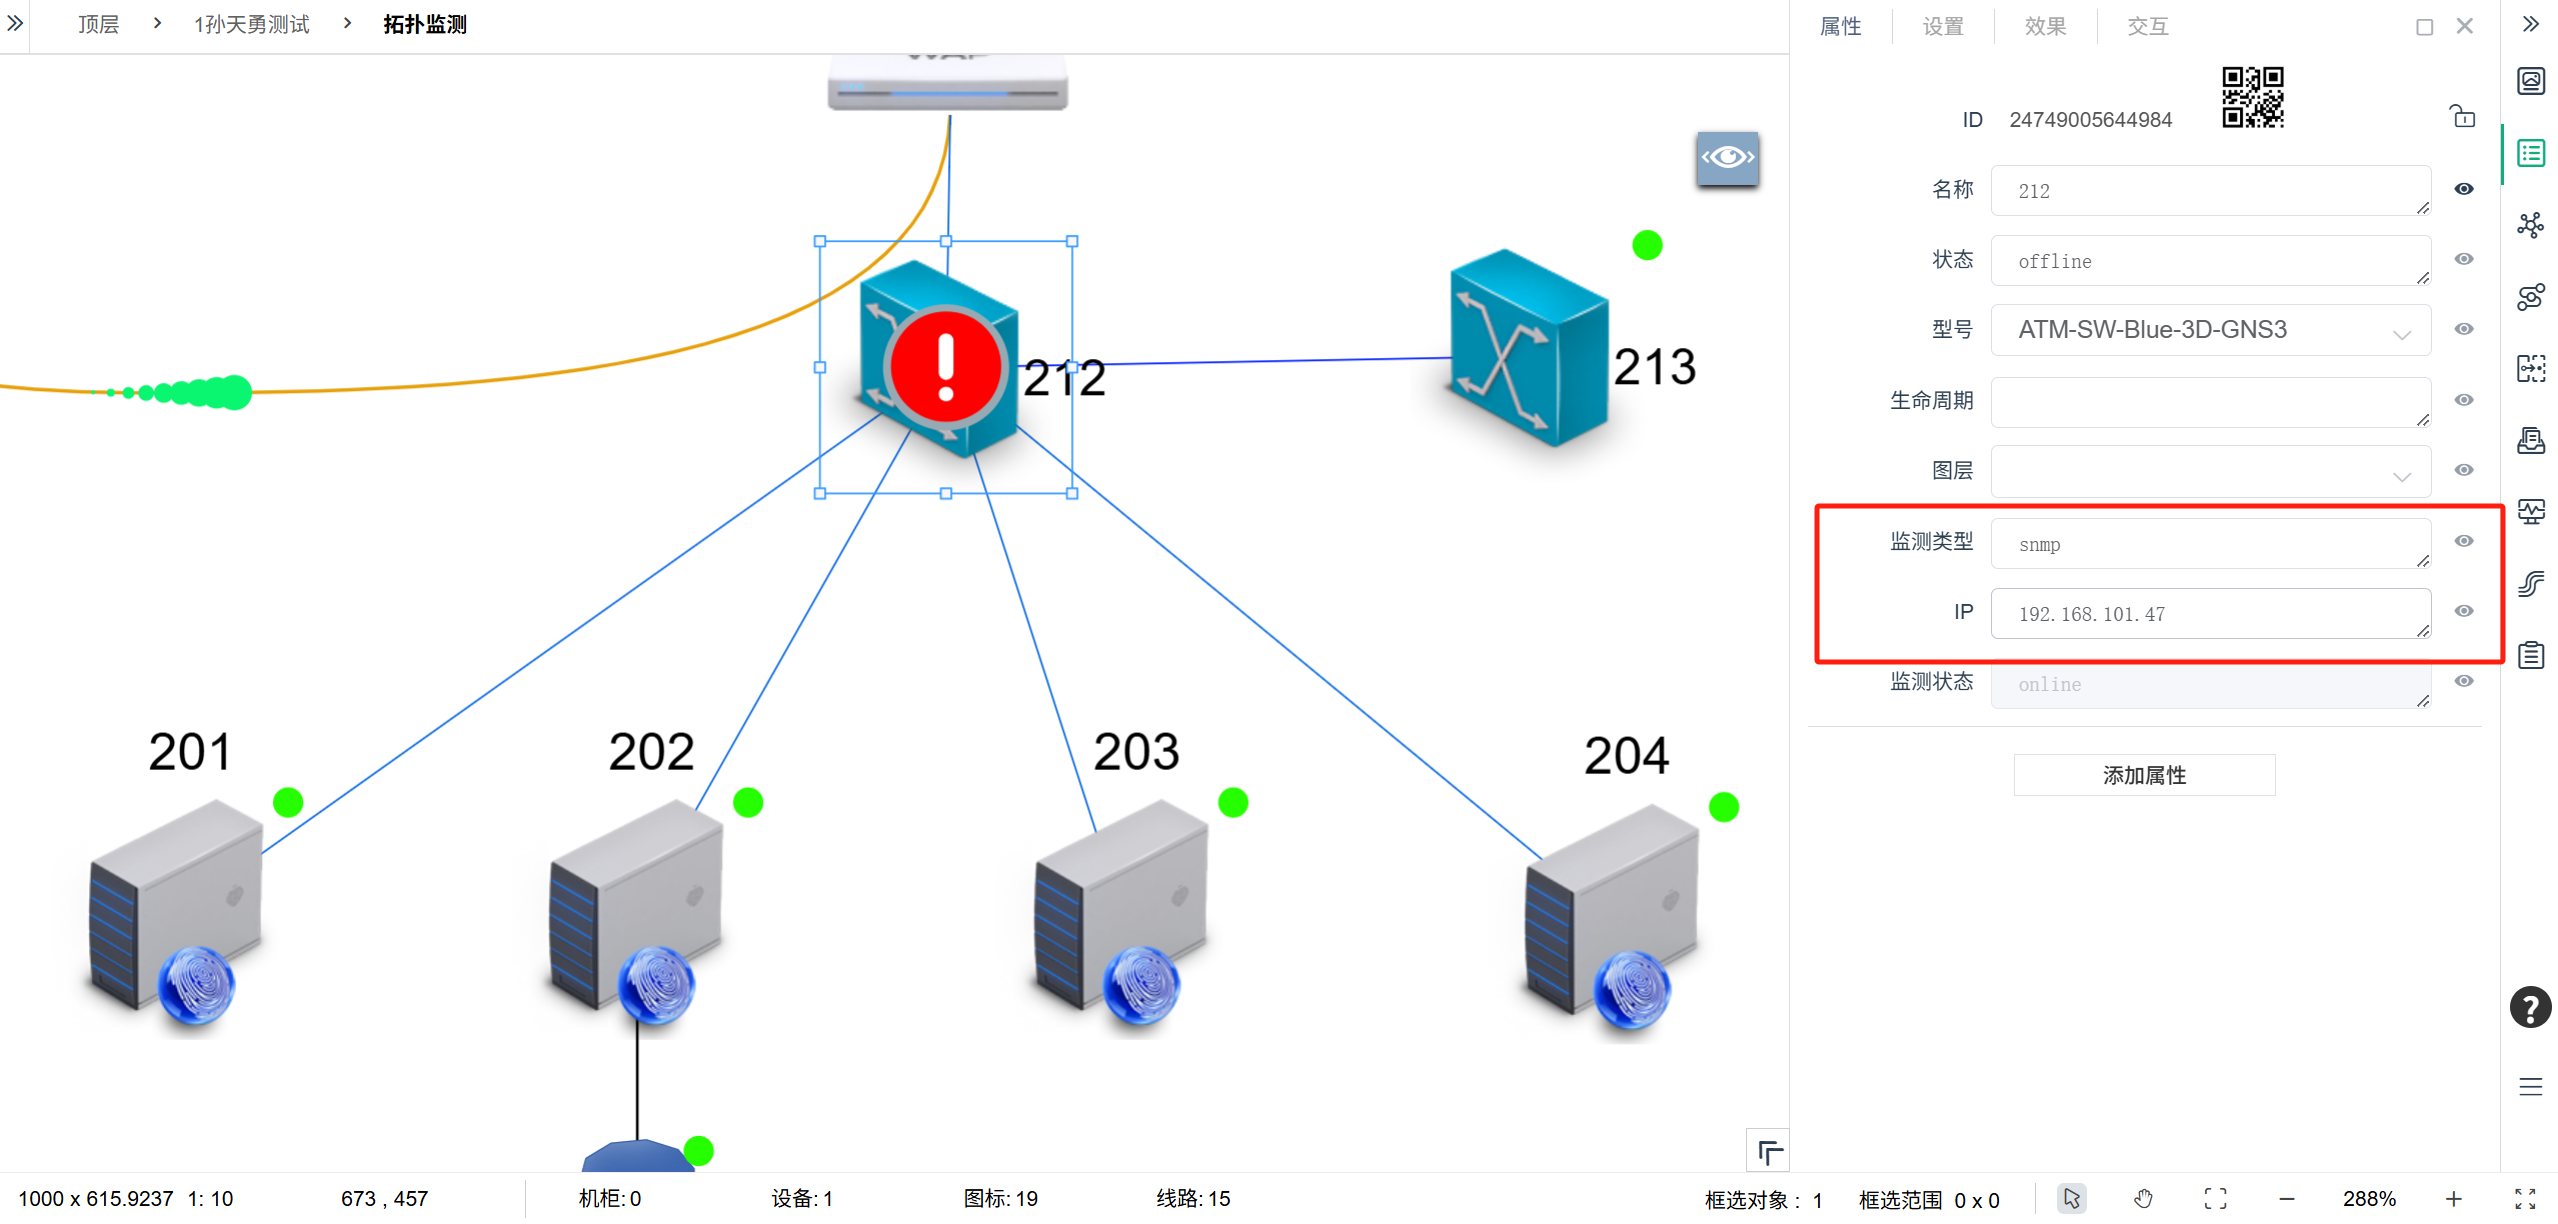
对象图标上会显示对象当前在线状态(online/offline)、告警状态。
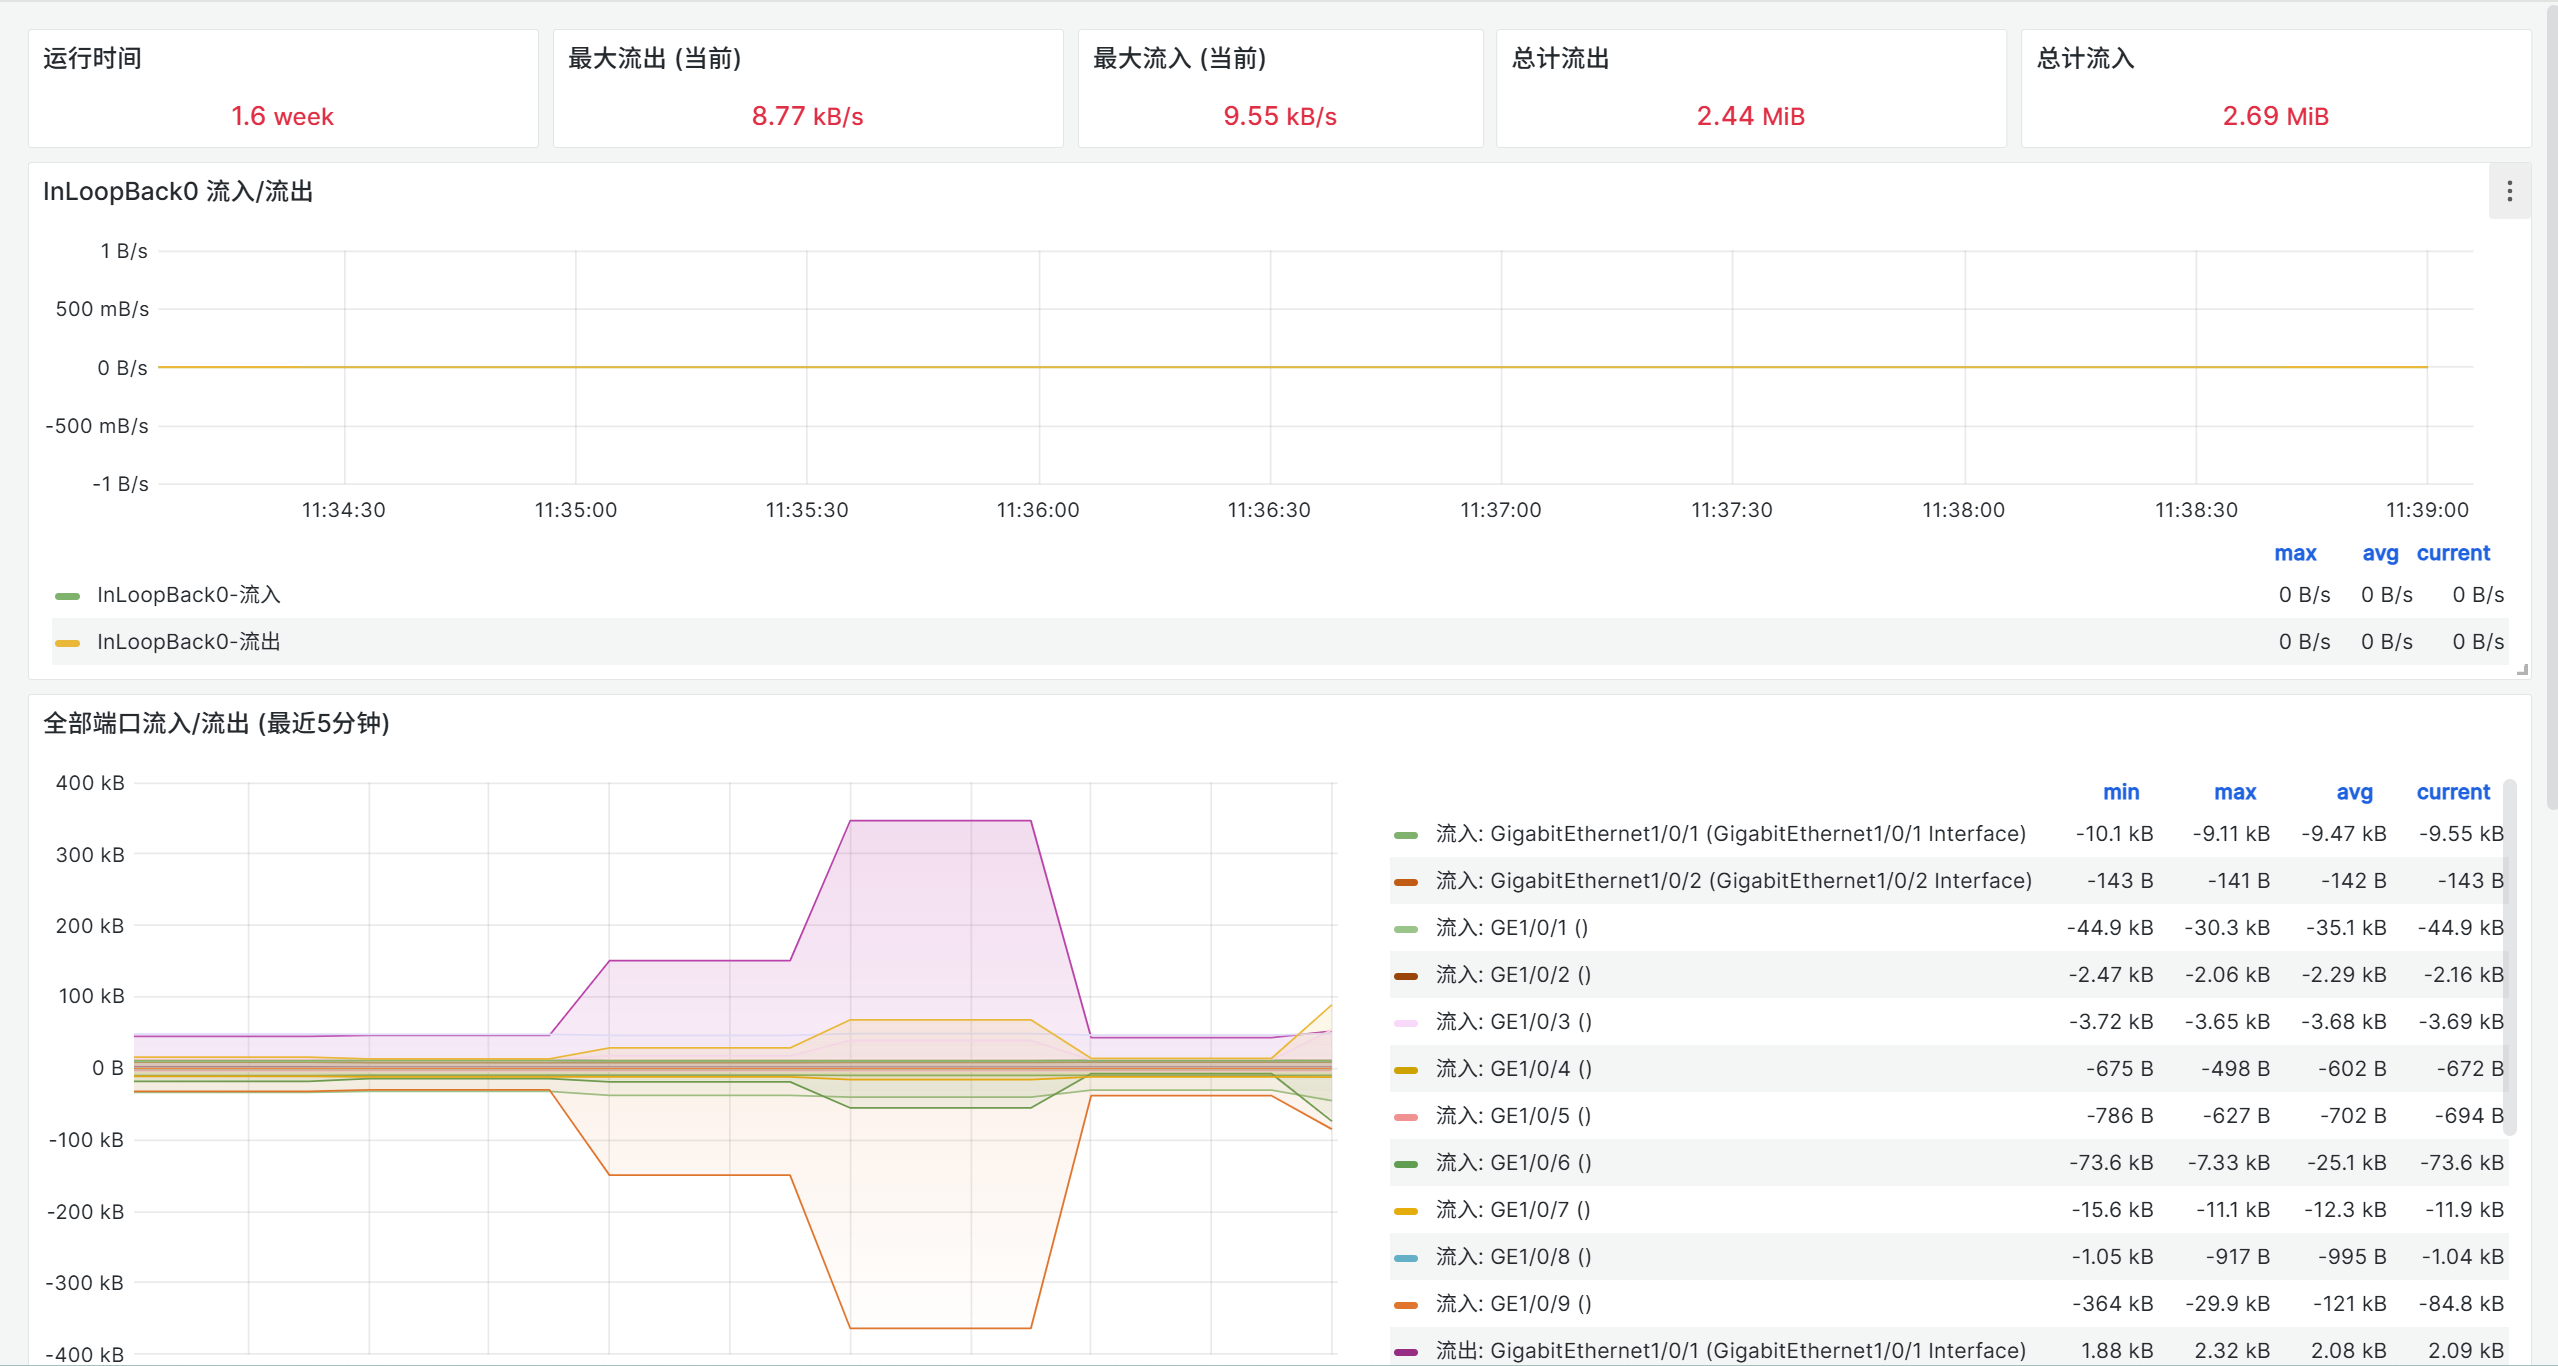
点击右侧实时监测图标,可以查看对象实时监测图标数据;
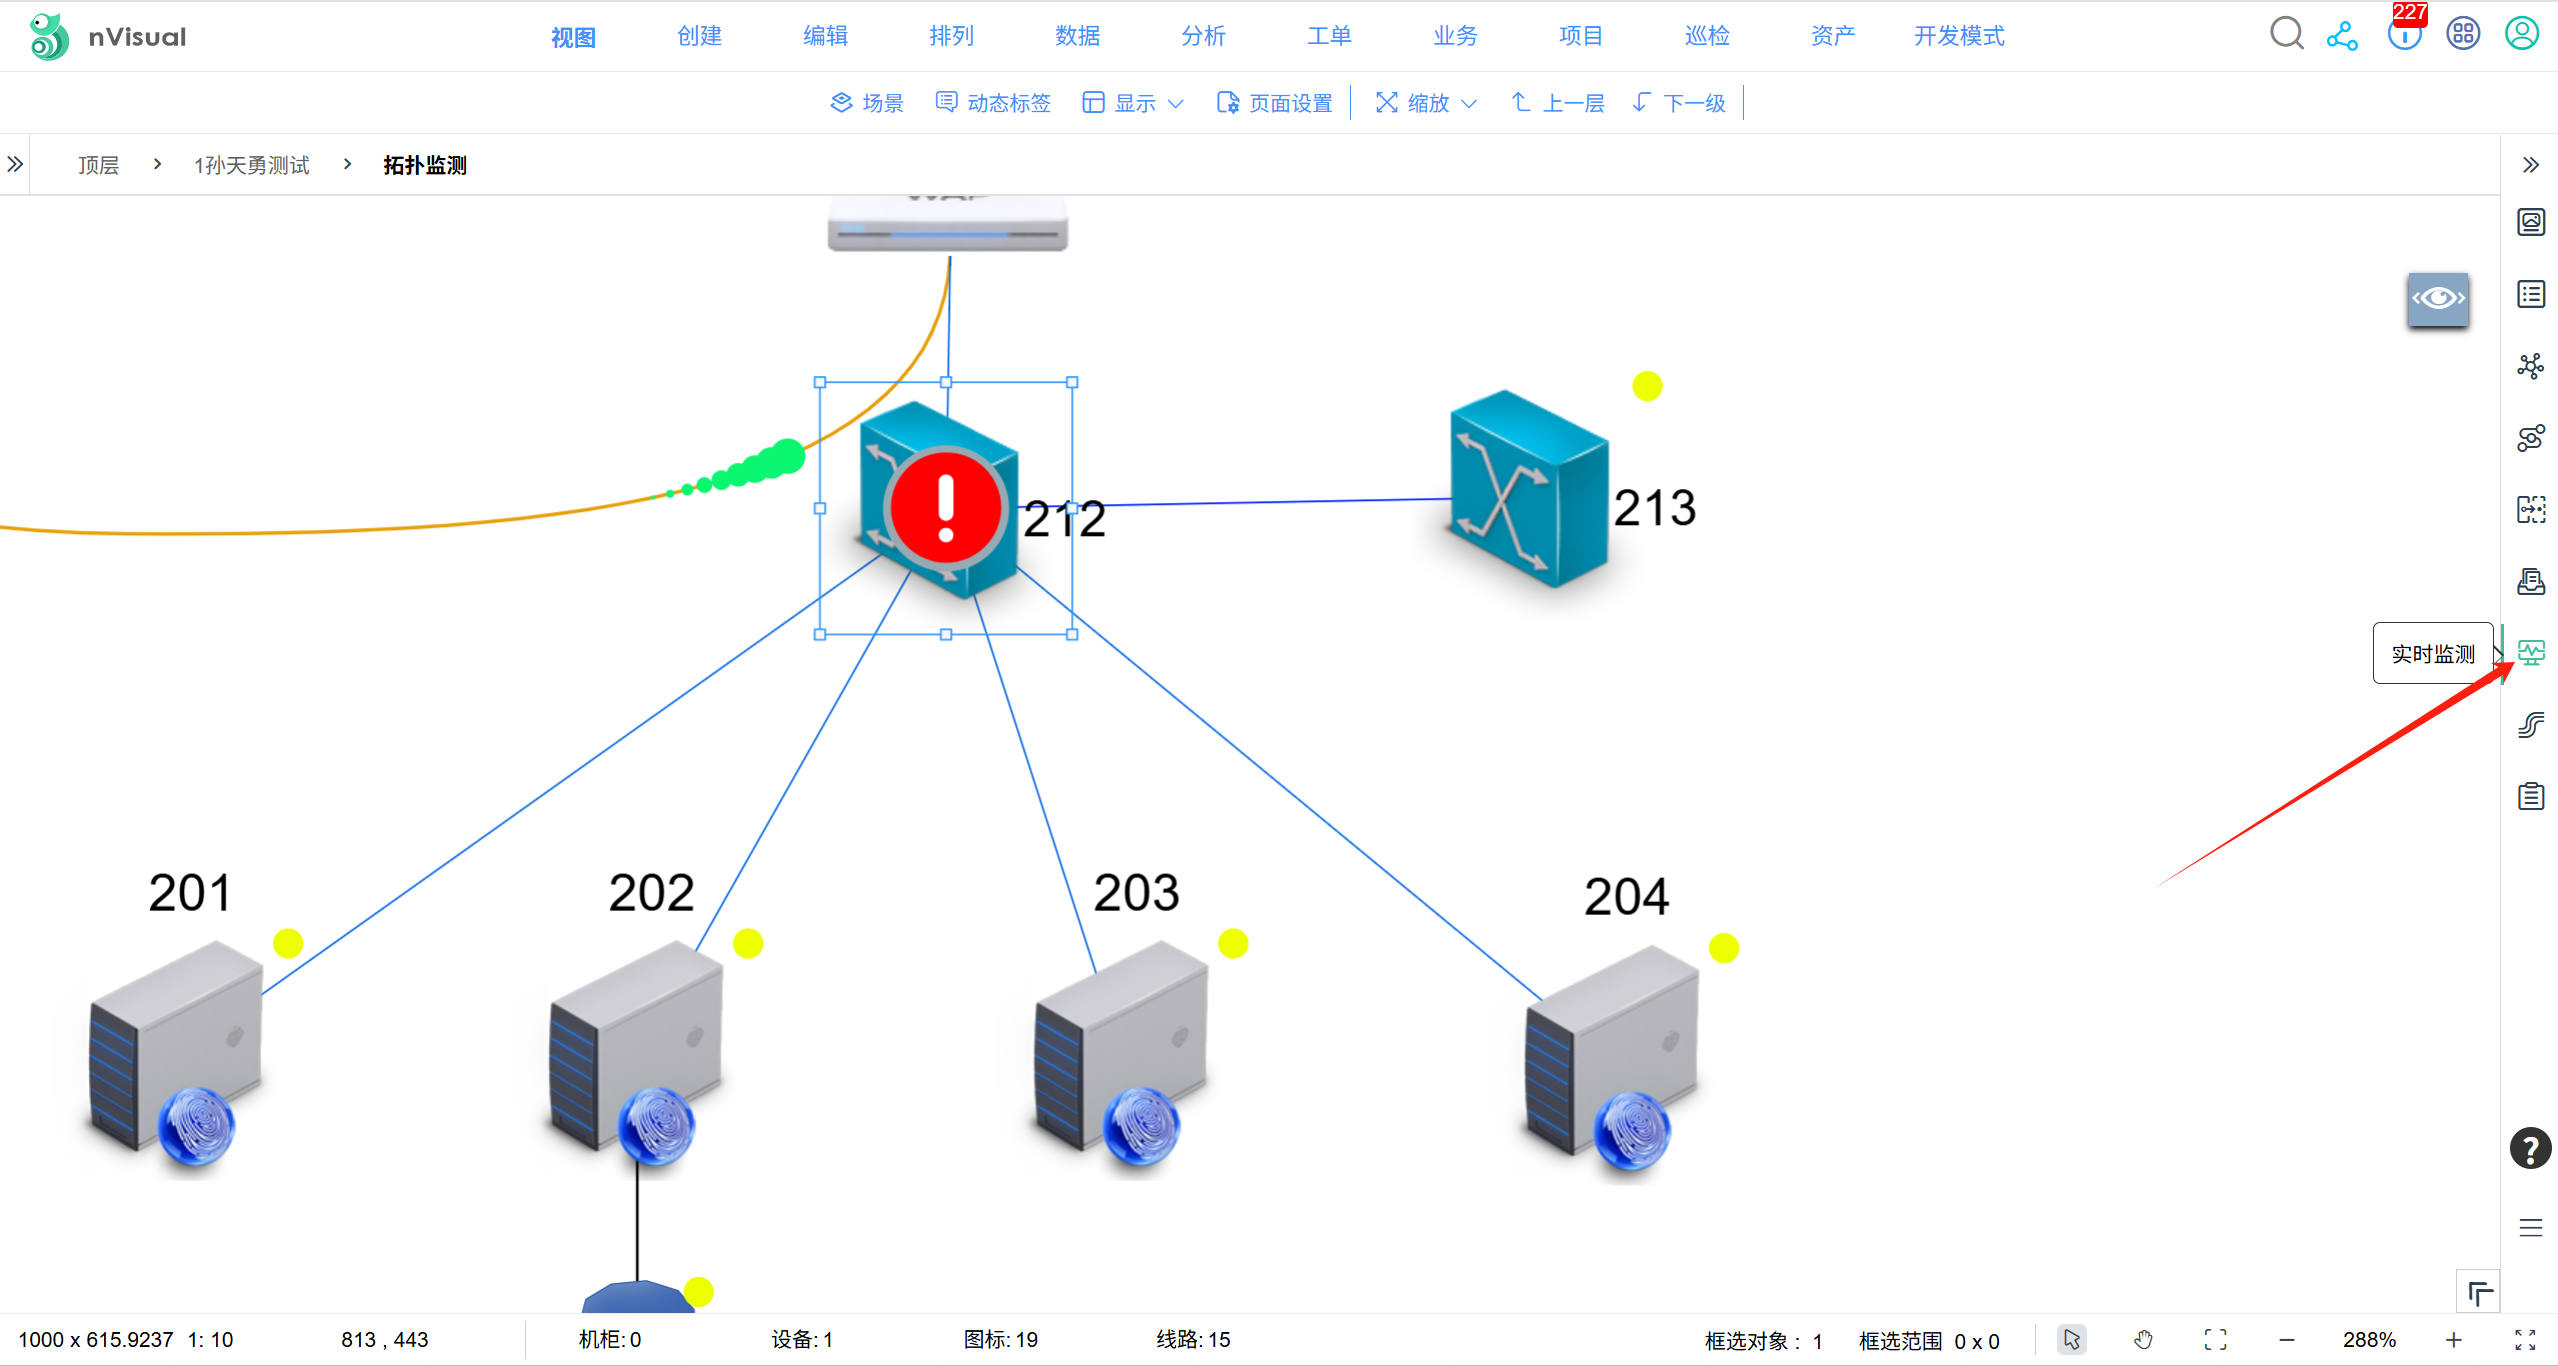
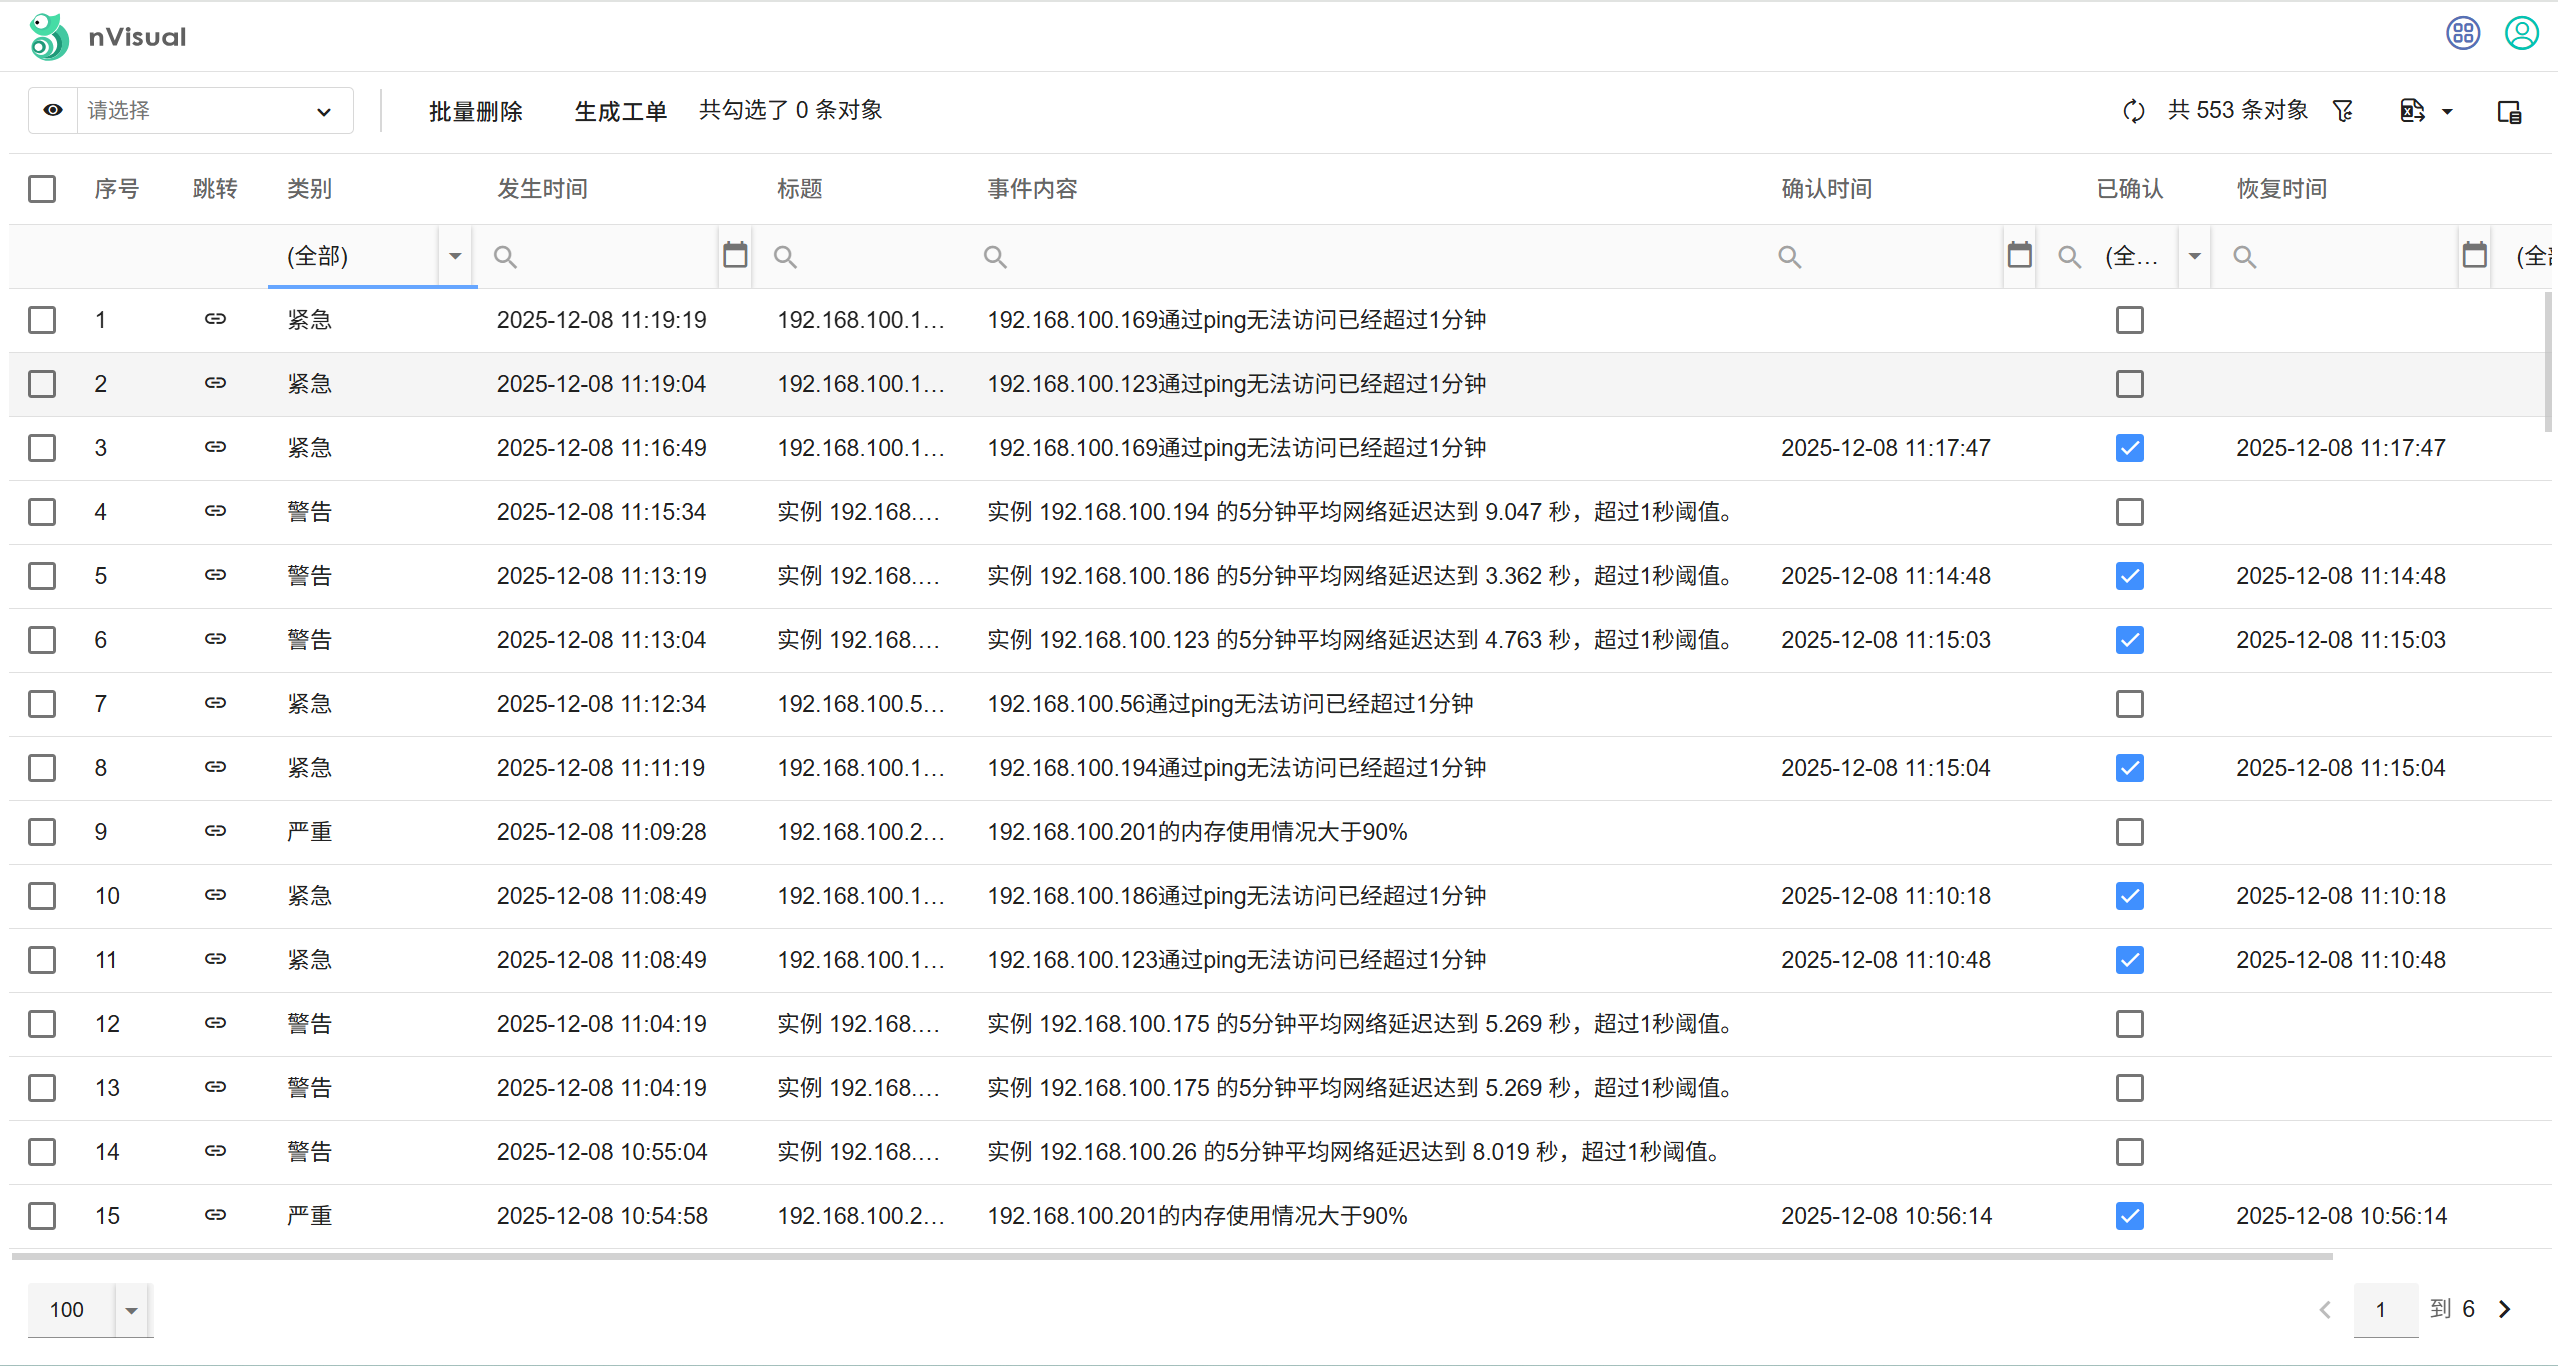
点击右上角告警图标,可以查看告警事件列表信息。
二、nVisual监测模块自定义配置说明
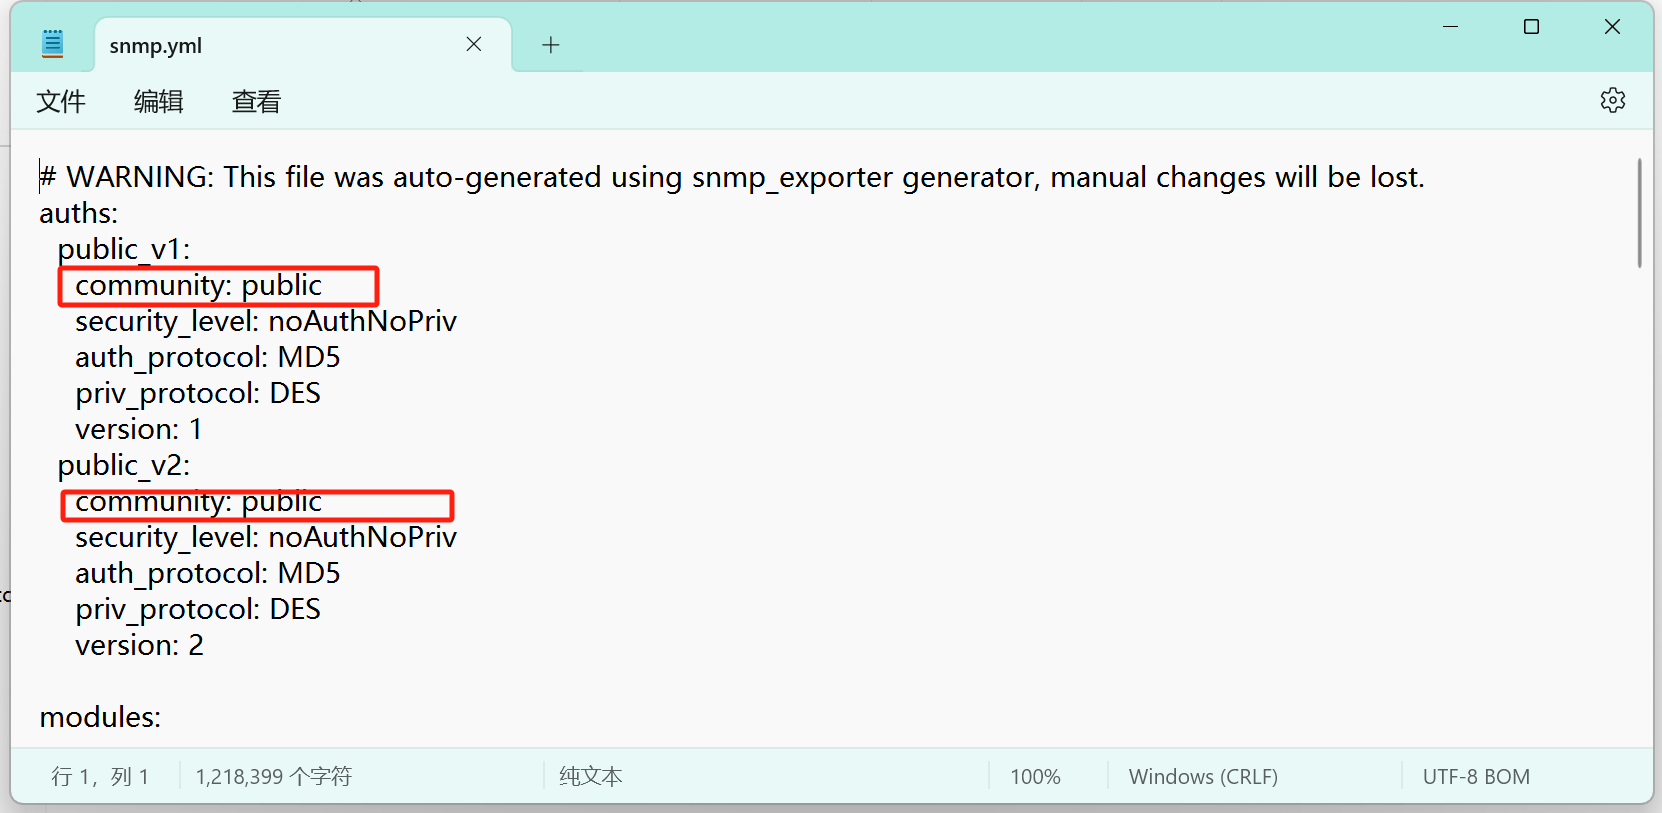
1、关于SNMP设备采集community值修改
snmp监测采集community默认是“public",如与实际不致,请修改exporter/snmp.yml配置文件的community的值。
2、关于预配置参数说明
Prometheus通过remote_write发送设备与端口状态给nVisual.
#prometheus/prometheus.yml
remote_write:
  - url: http://192.168.100.201:9090/diagramApi/wapi/v1/prometheus/write  #此处要更新为实际的nVisual接收地址
    bearer_token_file: ..\api-key.txt
    remote_timeout: 15s
    queue_config:
      capacity: 5000
      max_shards: 1
      min_shards: 1
      max_samples_per_send: 10000
      batch_send_deadline: 30s
      min_backoff: 1s
      max_backoff: 2m
    write_relabel_configs:
      - source_labels: [__name__]
        regex: 'nvisual_device_status|nvisual_port_status' # 只保留这些指标,减少写入量
        action: keep
Prometheus从nVisual自动发现监测对象.
    http_sd_configs:
      - url: "http://release.nvisual.com:9090/diagramApi/wapi/v1/prometheus/discovery?type=linux" #此处要更新为实际的nVisual发现地址
        bearer_token_file: ..\api-key.txt
        refresh_interval: 30s
alertmanager发送告警给nVisual.
# alertmanager/alertmanger.yml
receivers:
  - name: 'web.hook'
  webhook_configs:
  - url: 'http://192.168.100.201:9090/diagramApi/wapi/v1/webhook/alertmanager'  # #此处要更新为实际的nVisual告警接收地址
   send_resolved: true
   http_config:
     bearer_token_file: ..\api-key.txt
3、定义监测类型
选中任意对象,在右侧属性栏,点击监测类型,进入监测类型定义界面:
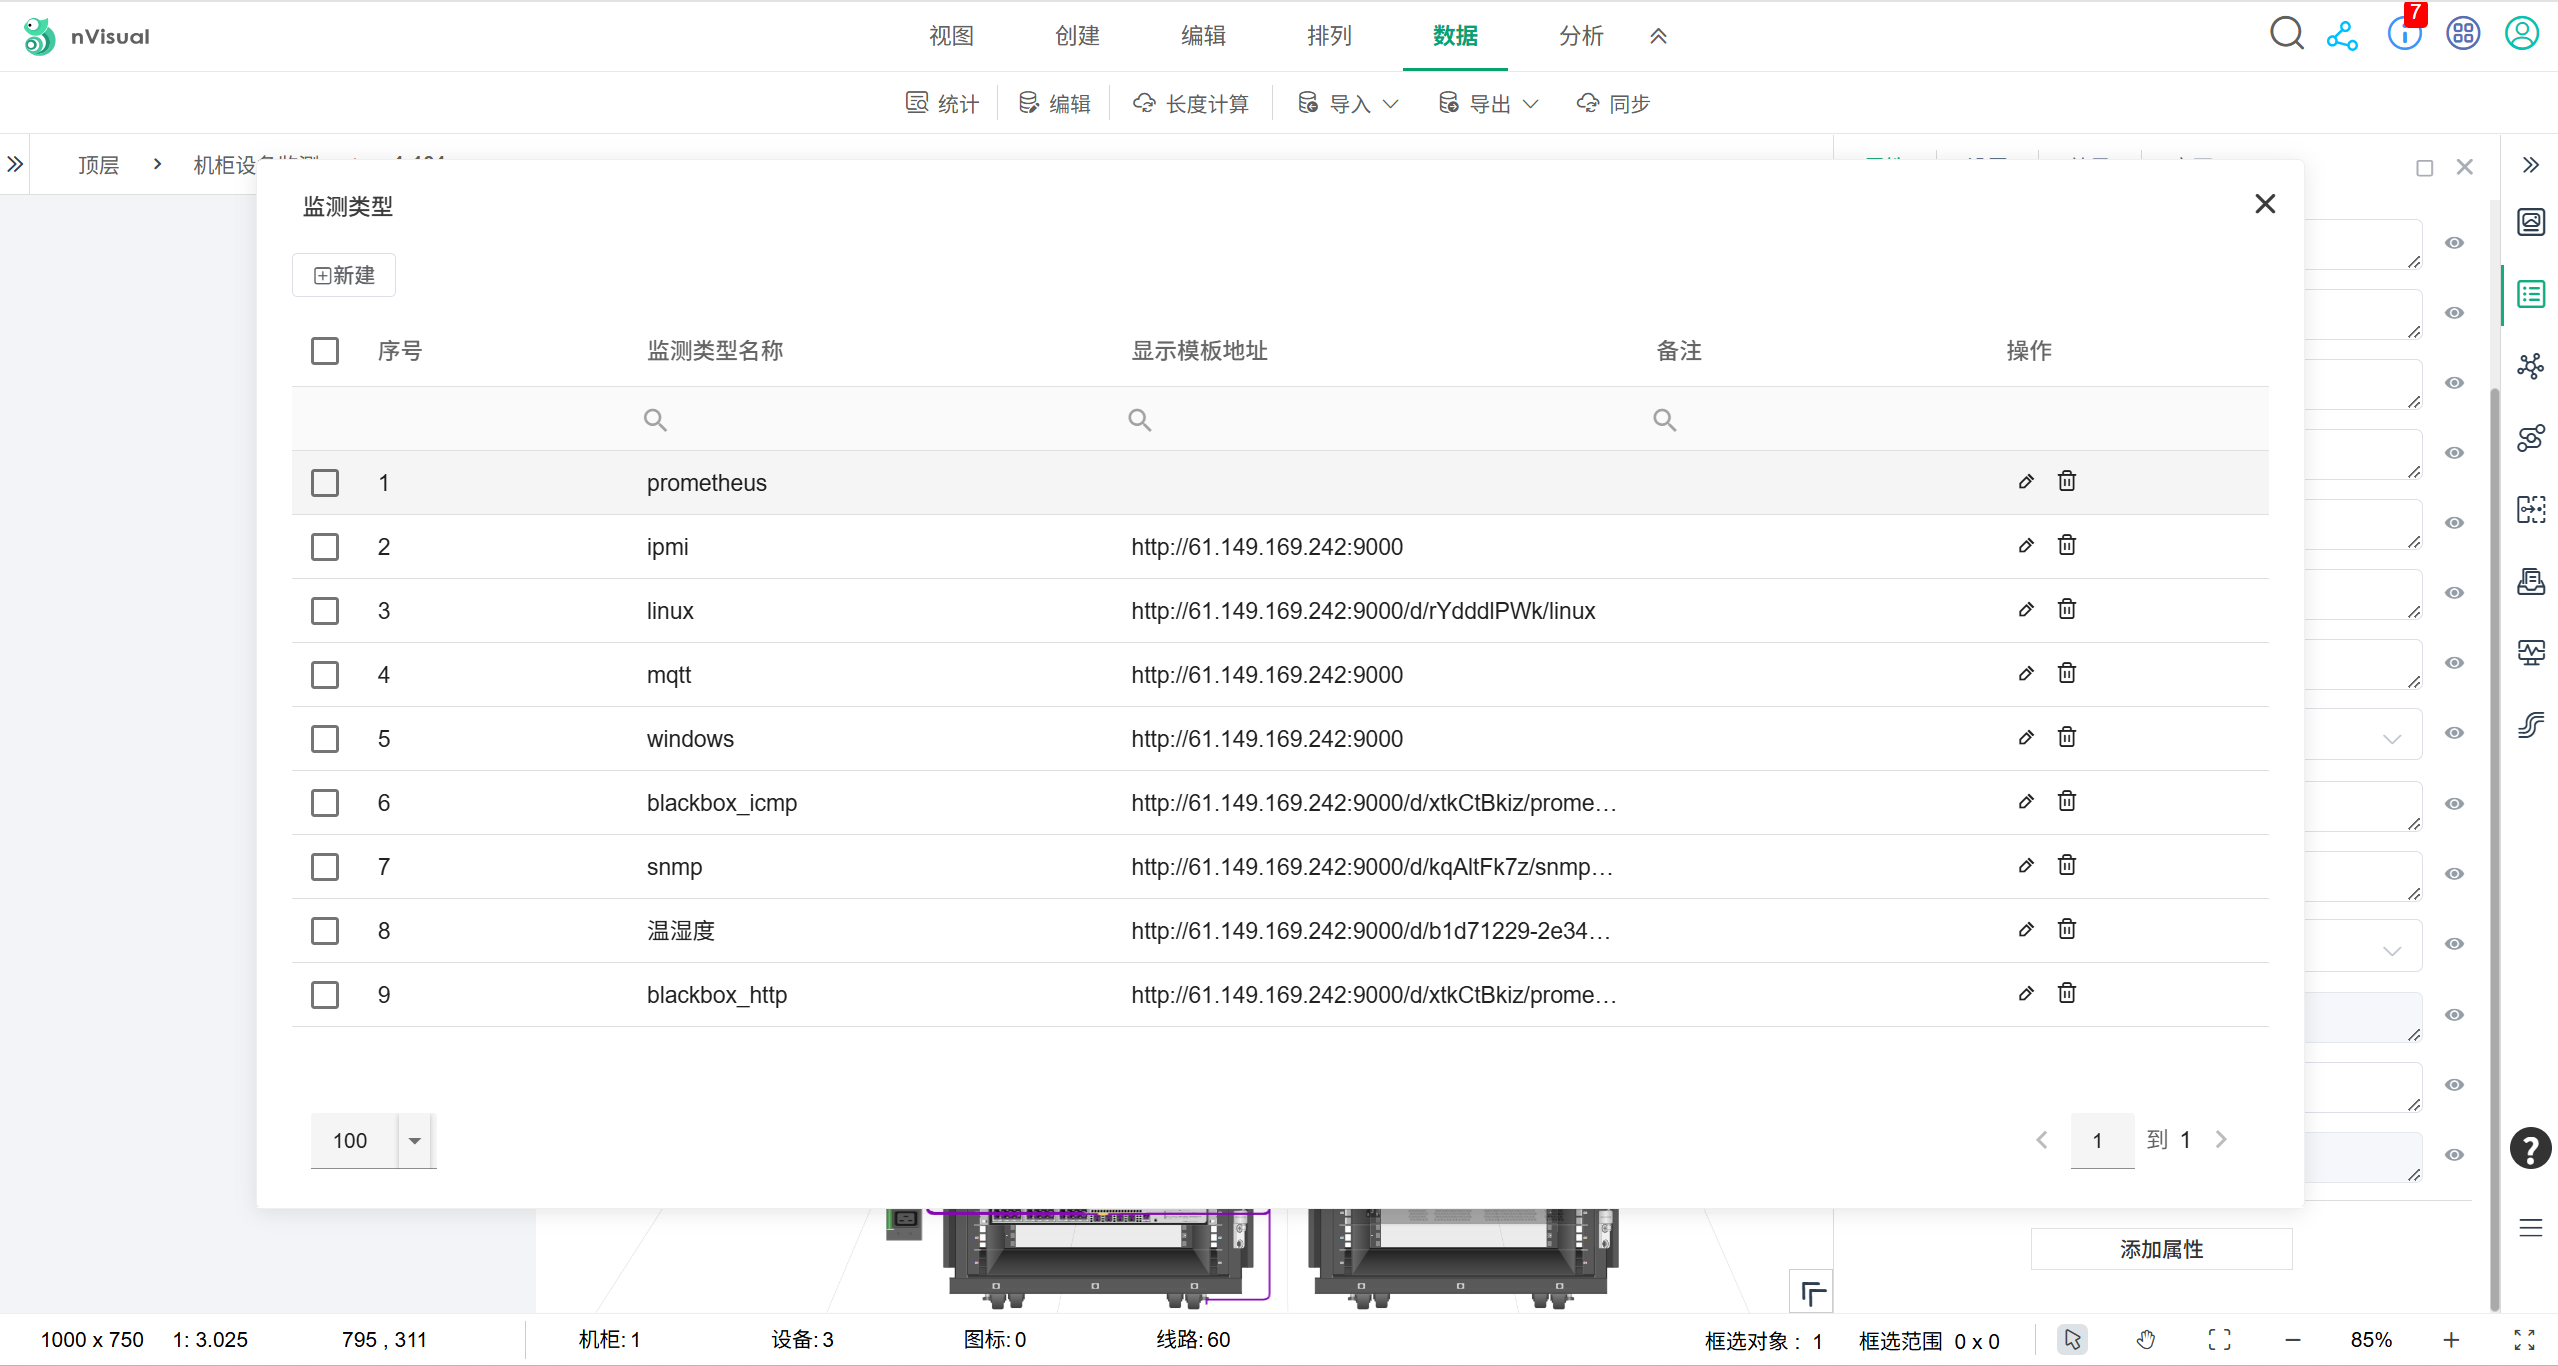
在监测类型管理界面定义你的监测类型,包括:
-
监测类型名称:用于监测类型显示与prometheus自动发现筛选对象范围,不要求与prometheus的scrape名称一致,但需要在http_sd_configs的
"http://release.nvisual.com:9090/diagramApi/wapi/v1/prometheus/discovery?type=linux" 配置一致(type=监测类型名称)
-
显示模版地址:用于定义此种监测类型的显示模版,默认采用grafana模板,粘贴grafana对应监测类型的仪表板地址到此处。显示模板地址变量定义格式为:{properties=nVisual属性名称},例如:IP定义为{properties=IP}